
On Tuesday, Wall Street Futures surged on hopes of an early Fed pivot after softer-than-expected US Composite PMI data for April and hopes & hypes of an upbeat earnings report card for Q1CY24; but overall report card may be termed as mixed. Wall Street was also being undercut by lingering geopolitical tension over the Gaza war, while Gold was getting a boost. Also hopes of an early end of QT by the Fed and more rate cuts in 2025-26 are boosting Gold (as the world is now gradually transforming from QT to QE again). The market is now expecting -75 bps rate cuts by the Fed in H2CY24, most probably from Sep’24 along with QT tapering.
Although the continuation of QT, even at a reduced pace (B/S shrinkage) and rate cuts are two contra tools and Fed should have finished the QT before going for rate cuts, say from Mar’25, the BOC, recently clarified that as long as policy rate remains within restrictive zone, BOC may go for limited rate cuts, If policy rate falls into stimulative zone, then BOC may go for more rate cuts and close or at least temporarily close the QT. BOC is the smaller proxy of the Fed and may have more clarity regarding its policy actions. But the Fed, as the world’s largest and systematically most important central bank, Fed may not go for any rate cuts while continuing QT (even a reduced pace) as these are two contra tools.
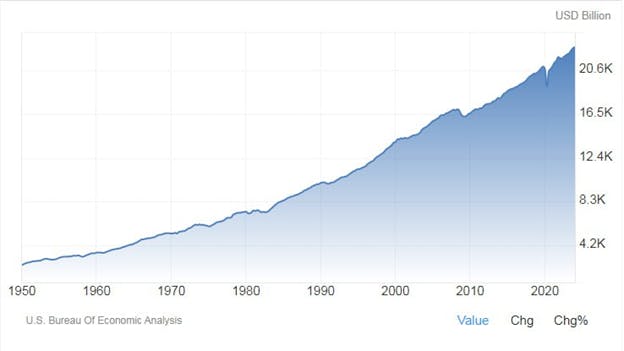
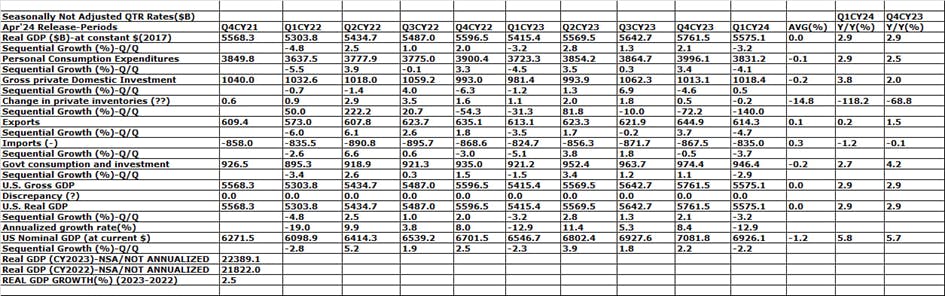
On Thursday some focus of the market was also on US GDP data. The BEA flash estimate data shows U.S. real GDP for Q1CY24 was around $22768.90B against $22679.30B sequentially (+0.40%) and $22112.30B yearly (+2.97%); all in 2017 constant prices and at seasonally adjusted annual rates. In other words, the U.S. economy has expanded by around +0.40% sequentially (Q/Q), which is equivalent to a +1.6% annualized rate, lower than the market consensus of +2.5% and lowest since H1CY22 contractions. In the previous QTR, the U.S. Real GDP grew at an annualized rate of +3.4% to around $22669.90B.
The BEA said:
In Q1CY24, The increase in real GDP primarily reflected increases in consumer spending, residential fixed investment, non-residential fixed investment, and state and local government spending that were partly offset by a decrease in private inventory investment. Imports, which are a subtraction in the calculation of GDP, increased.
The increase in consumer spending reflected an increase in services that was partly offset by a decrease in goods. Within services, the increase primarily reflected increases in health care as well as financial services and insurance. Within goods, the decrease primarily reflected decreases in motor vehicles and parts as well as gasoline and other energy goods.
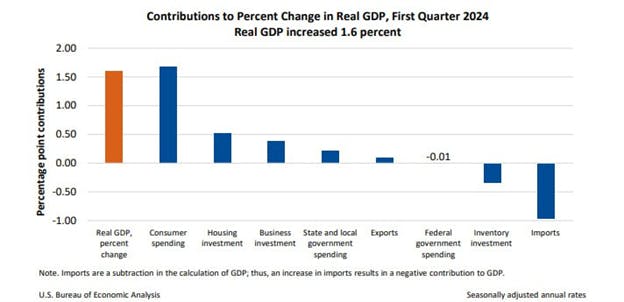
Within residential fixed investment, the increase was led by brokers’ commissions and other ownership transfer costs as well as new single-family housing construction. The increase in non-residential fixed investment mainly reflected an increase in intellectual property products. The increase in state and local government spending reflected an increase in compensation for state and local government employees. The decrease in inventory investment primarily reflected decreases in wholesale trade and manufacturing. Within imports, the increase reflected increases in both goods and services.
The US nominal GDP (at current prices) was around $28284.50B vs $27957.00 sequentially (+1.2%) and $26813.60 yearly (+5.5%); i.e. the annualized growth rate for US nominal GDP was around +4.7% in Q1CY24 against +5.0% in the previous QTR. The US real GDP/Capita was around $65.81K in 2023 against $64.50K in 2022; i.e. a growth of around +2.0%.
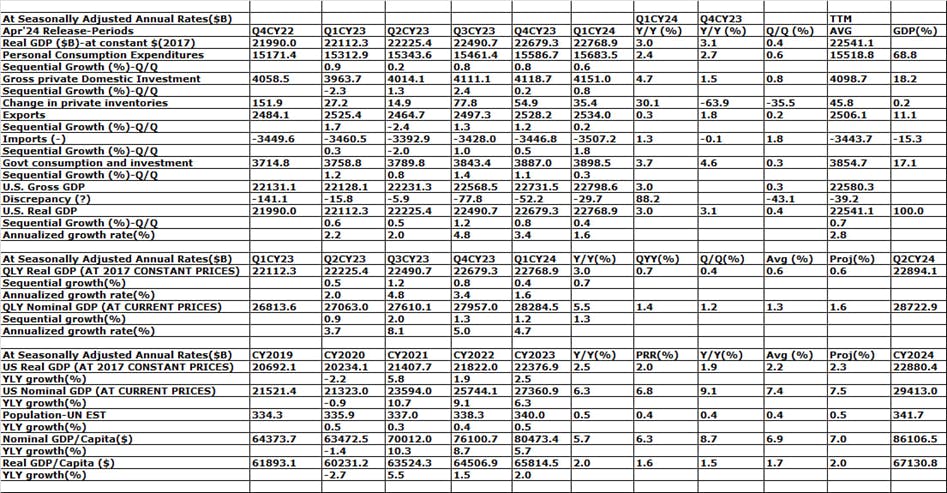
The core price index for personal consumption expenditures (Core PCE) in the GDP data rose by an annualized +3.7% in Q1CY24, accelerating from the +2.0% increase in the previous QTR and above the market expectations of +3.4%.
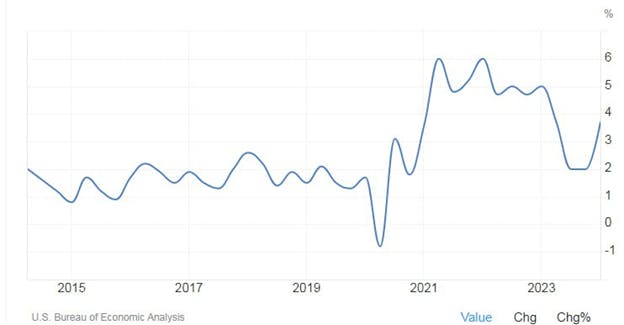
Overall, the U.S. real GDP is now poised to grow around 2.0-2.5% in 2024, largely in line with the Fed’s estimate and trend rate.
On seasonally not adjusted and quarterly rate (not annualized), the actual US Real GDP was around $5575.10B in Q1CY24 vs $5761.50B sequentially (-3.24%) and $5415.40 (+2.9%). The U.S. real GDP got a boost of around $2T in 2023 after changing the base year from 2012 to 2017 constant prices.
Overall on Thursday, Wall Street Futures, Gold briefly slid on hotter than expected US core PCE index for consumption expenditure component in the GDP data, which may be indicating underlying strong consumer spending and elevated inflation. At the same time, a soft reading of GDP growth is an indication of slowing economic activity. Together this may be an indication of stagflation (elevated/higher inflation, higher unemployment, and lower GDP growth). Thus Wall Street Futures slid, while Gold surged to some extent. Also, lingering geopolitical tensions over the Gaza War helped gold and dragged Wall Street after Israel launched a full-fledged Rafah attack. But Wall Street also recovered later as the Q1CY24 GDP report may not change the Fed’s plan for the rate action in the coming months as the overall trend is now showing goldilocks nature (not too hot or too cold) from prior too hot.
Technical trading levels: DJ-30, NQ-100, and Gold
Whatever may be the narrative, technically Dow Future (38800), now has to sustain over 38950 for a further rally to 39100/39200-39500/39700 and 40000/40200-40425/40600-40700 to 42600 levels in the coming days; otherwise, sustaining below 38900-38800 may again fall to 38450-38300/38050-37650/37500*, and further fall to 37400/37200-37050/36600 and 36300/36300 and even 35700 levels in the coming days.
Similarly, NQ-100 Future (17750) now has to sustain over 17800 for a further rally to 17900-18100/18250 and 18550/18700-18800/18900-19000/19200-19450/19775 and 20000/20200 in the coming days; otherwise, sustaining below 17750, NQ-100 may again fall to around 17400-17100-16800/16595*-160000/15800 in the coming days.
Also, technically Gold (XAU/USD: 2330) now has to sustain over 2350 for a further rally to 2375/2385-2395 and 2400/2410-2425/2435* for any further rally to 2455-2475/2500; otherwise sustaining below 2335-2335, may again fall to 2315-2300 and 2290/2270-22245/2240, and 2220/2210-2200/2195-2190/2180 and 2175/2145*, and further to 2120/2110-2100/2080-2060/2039 and 2020/2010-2000-1995/1985-1975 and even 1940 may be on the card.
Bottom line:
Wall Street slid on stagflation fear after GDP and PCE data, but recovered amid upbeat report card by big techs; Gold wobbled amid softer than expected GDP, hotter than expected core PCE Index
The materials contained on this document are not made by iFOREX but by an independent third party and should not in any way be construed, either explicitly or implicitly, directly or indirectly, as investment advice, recommendation or suggestion of an investment strategy with respect to a financial instrument, in any manner whatsoever. Any indication of past performance or simulated past performance included in this document is not a reliable indicator of future results. For the full disclaimer click here.
Join iFOREX to get an education package and start taking advantage of market opportunities.
 A beginner's e-book
 $5,000 practice demo account
 A 12-part video course