Don't have an account?
Register via AppHave an account?
Login
Don't have an account?
Register via AppHave an account?
Login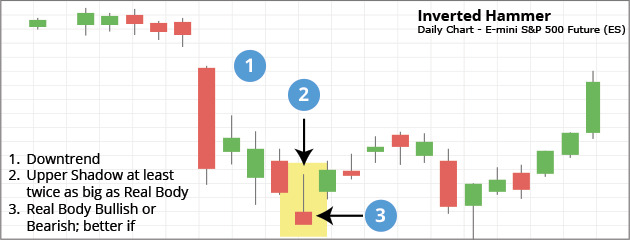
In spite of its impressive name, you don’t have to do any geometrical inversions in your mind in order to understand the Inverted Hammer candlestick. Essentially, it’s only an alternative version of the standard Hammer. The most salient difference between the two is the location of the long shadow, which is not at the bottom of the candle, as with the regular Hammer, but on top of it. Traders react to the Inverted Hammer pattern very similarly to the regular Hammer, which is normally by closing short positions or opening long positions in anticipation of bullish price action.
This isn’t to say that they react this way in a snap fashion. This candlestick pattern is usually regarded, not as a definite buy signal, but as an indication that the dominant sentiment is changing from a bearish one to a more optimistic one. The opposite positioning of the shadow shows that the trader behaviour we are monitoring is different in some way from that reflected by a regular Hammer. But, as we’ll see, the meaning of the pattern amounts to pretty much the same thing. Let’s start by taking a look at an Inverted Hammer candlestick pattern and discussing what the colours and shapes are telling us.
In the case of the standard Hammer, the long shadow would appear at the base of candle number three rather than on top, as it is in the picture. That’s because it indicated selling pressure that had been repelled by the stubborn bulls. The bears’ attempt to continue pushing prices groundward was forcefully halted and it was this display of bullish resistance (in the middle of a bear run) that gave us reason to believe prices were about to go up. The bulls were going to build on their resistance to actually force prices upwards in the next session.
But, in the case of the Inverted Hammer pattern, what does the long upper shadow mean? It records the upper limit to which the bulls drove prices during the session after opening much lower. Rather than representing how low prices could have gone if not for the bulls, (as with the standard Hammer) it represents how high the bulls indeed managed to push prices during the session, (even though they were sent back by the end). As we see indicated by our Inverted Hammer’s short real body, prices ended up close to where they started for the session. But the extended upper shadow gives us a different kind of record of the bullish energy building up behind the scenes. The message of the shadow is: “The bulls put up enough of a fight to send prices this high!”. It’s true that the bulls didn’t win the day outright, because the bears, in fact, came back and proved they still had some life in them. But in a real sense, the bears did fail. They failed to keep driving prices lower, as they had been doing until now. The fact that prices settled in the area of where they started for the day puts them to shame, as does the fact that prices went positively against them during the session. And what gives us reason to believe in a bullish future is the fact that this pattern occurred during a downtrend, as we’ll explain.
As usual, the meaning of the candlestick pattern must be understood in the context of price history. Here we see the bears had been in control of prices coming up to candle number three, successfully using the trading sessions to push prices further and further downward. Candle three shows that something different happened in the third session: namely, that the bulls managed to, not only halt the downward price action, but also temporarily turn the tables on their rivals and give them a taste of their own medicine. As to the fact that the bears re-asserted themselves before the end, we’re not so impressed by that. We believe they don’t have the strength left in them to win the next session.
We can compare it to a spirited uprising on the city streets that was put down by the police after an extended struggle. The impression we get at the end of the day is not so much that the police are firmly in control, but rather that there’s real trouble brewing behind the scenes. The rebels will likely make another go at it tomorrow, at which time they’ll be better prepared and may give the police a run for their money! This is why the Inverted Hammer acts as a bullish buy signal. But how do you trade it?
We’ve mentioned that you’ll need confirmation before going out and trading the Inverted Hammer pattern, and let’s start with the more basic types. If your Inverted Hammer’s upper shadow is longer, it means you have a stronger buy signal. This is understandable because the bulls displayed more power in such a case. Secondly, the colour of the real body can influence the intensity of your signal: A white (or green) real body has more of a bullish connotation than a black (or red) one. Technically, though, it’s still called an Inverted Hammer pattern even if its body is black.
Now, take a look at the green candle that follows candle number three in our picture. As you can see, it starts at a gap above candle three, which means prices started off in that session higher than they ended in session three. That gap functions to confirm your suspicions of a bullish upturn. The relatively long green candle itself is also confirmation, because it shows prices started to actually behave the way we anticipated.
The experts wouldn’t stop there, however. They would check out momentum indicators to get confirmation that a change is occurring in favour of the bulls, and they would also look at indicators of trading volume. If trading volume is building up, it’s potentially a sign of buying pressure that’s about to overflow. Each of these kinds of indicators can be a big help to you in, either confirming your buy deal and easing your nerves on its score, on the one hand, or saving you the expense and stress of a trading error, on the other.
Just a small point about confirmation: It’s true that the more of it you can muster, the better. At the same time, you don’t want to wait too long once you have confirmed there’s solid basis to believe in an uptrend. The reason is that your trading opportunity may fly away from you before you grasp it. What you need to aim for is a balance between gathering robust evidence of a bull run, and the poise to open your deal in a timely fashion. With experience, it becomes easier to pull off striking this balance consistently. You can gain the experience you need without spending a penny, by simply making use of iFOREX’s free demo account, which gives you the opportunity to try out your trading strategies in real time without any money on the line.
Don’t forget your stop loss, which you should place at a recent support level. Look for a prominent area of resistance up top if you want to place a take profits order.
A final reminder to closely observe, not just the dimensions of the patterns on your price charts, but the price history too. If you transplanted our candle number three – exactly as it is – to some point on a price uptrend, it would no longer be an Inverted Hammer at all. Rather, it would be called a Shooting Star, which is a pattern that signifies bearish pressure is building up. We see, then, that the context in which a candlestick pattern appears can determine its entire meaning.
When an influential businessman, speaking about a deal he’s hoping to complete, says “I’ll make him an offer he can’t refuse”, his meaning is clear. But when the Godfather says those same words, we know his meaning is very different, and that his intentions are to “seal the deal” in an entirely different way.
So it is in the business of reading candlestick charts and, in our case, the Reverse Hammer Candlestick pattern. Rather than mechanically interpreting the patterns’ meanings, we’re trying to discern what all the various indicators are pointing to overall with regard to future price action. This is more of a subtle process, but it gets more efficient with diligent practice.
The materials contained on this document should not in any way be construed, either explicitly or implicitly, directly or indirectly, as investment advice, recommendation or suggestion of an investment strategy with respect to a financial instrument, in any manner whatsoever. Any indication of past performance or simulated past performance included in this document is not a reliable indicator of future results. For the full disclaimer click here.
Join iFOREX to get an education package and start taking advantage of market opportunities.
 A beginner's e-book
 $5,000 practice demo account
 A 12-part video course
 Trusted partner
 Featured partner